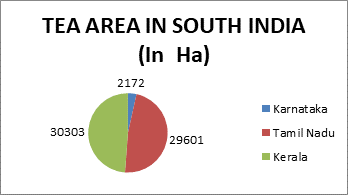
Number of Growers & Area in South India:
|
Sl. No. |
States |
No. of Growers & Acreage
|
|||||
|
Big Growers@ |
Small# |
Total * |
|||||
|
No. |
Area (Ha) |
No. |
Area (Ha) |
No. |
Area (Ha) |
||
|
1 |
Karnataka |
16 |
2171.74 |
– |
– |
16 |
2171.74 |
|
2 |
Tamil |
133 |
29600.56 |
45765 |
33284.57 |
45898 |
62885.13 |
|
3 |
Kerala |
93 |
30303.42 |
8497 |
5567.74 |
8590 |
35871.16 |
|
4 |
South |
242 |
62075.72 |
54262 |
38852.31 |
54504 |
100928.03 |
|
5 |
All |
1569 |
420670.63 |
210225 |
215886.44 |
211794 |
636557.07 |
|
|
Tea |
||||||
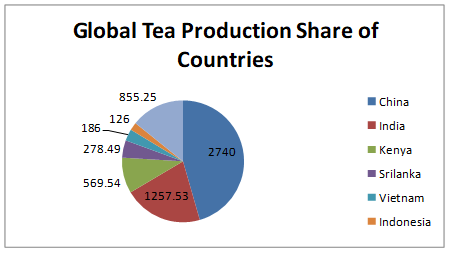
GLOBAL PRODUCTION:
|
Position |
Country |
2017 |
2018 |
2019 |
2020 |
Change |
% Change |
|
1. |
China |
2496.41 |
2610.39 |
2799.38 |
2740.00 |
– 59.38 |
– 2.12 |
|
2 |
India |
1321.76 |
1338.63 |
1390.08 |
1257.53 |
– 132.55 |
-9.53 |
|
3 |
Kenya |
439.86 |
493.00 |
458.85 |
569.54 |
110.69 |
24.12 |
|
4 |
Sri |
307.72 |
304.01 |
300.13 |
278.49 |
-21.64 |
-7.21 |
|
5 |
Vietnam |
175.00 |
185.00 |
190.00 |
186.00 |
– 4.00 |
-2.10 |
|
6 |
Indonesia |
134.00 |
131.00 |
128.80 |
126.00 |
– |
-2.17 |
|
7 |
Others |
843.64 |
904.18 |
882.84 |
855.25 |
– |
-3.12 |
|
|
World |
5718.39 |
5966.21 |
6150.08 |
6012.81 |
– |
-2.23 |
|
|
In Million Kgs. |
||||||
Domestic Tea Production (Calendar Year):
The production in different regions of
India is:
|
Years |
Tamil |
Kerala |
Karnataka |
South India |
North India |
All India |
|
2017 |
166.9 |
62.4 |
5.4 |
234.7 |
1087.1 |
1321.8 |
|
2018 |
158.86 |
60.82 |
5.19 |
224.87 |
1113.76 |
1338.63 |
|
2019 |
156.00 |
59.26 |
4.86 |
220.12 |
1140.69 |
1360.81 |
|
2020
|
160.04 |
66.85 |
5.34 |
232.23 |
1050.80 |
1283.03 |
|
2021
|
168.67 |
61.11 |
5.24 |
235.02 |
1108.04 |
1343.06 |
|
Source: |
||||||
EXPORTS
WORLD EXPORTS
|
Country |
2017 |
2018 |
2019 |
2020 |
Increase |
% Decrease |
|
Kenya |
415.72 |
474.86 |
496.76 |
518.92 |
22.16 |
4.5 |
|
China |
355.26 |
364.71 |
366.55 |
348.82 |
-17.73 |
-4.83 |
|
Sri |
278.20 |
271.78 |
289.59 |
262.73 |
-26.86 |
-9.27 |
|
India |
251.91 |
256.06 |
252.15 |
207.58 |
-44.57 |
-17.67 |
|
Vietnam |
140.00 |
130.00 |
136.00 |
130.00 |
-6.00 |
-4.4 |
|
World |
1797.01 |
1863.13 |
1903.67 |
1824.77 |
-78.9 |
-4.14 |
|
ITC |
||||||
Domestic Tea Exports:
|
|
North |
South |
All |
||||||
|
Qnt# |
Value*
|
Unit@ |
Qnt# |
Value* |
Unit@ |
Qnt# |
Value* |
Unit@Price |
|
|
2017 |
157.7 |
3480.9 |
220.75 |
94.2 |
1506.7 |
159.91 |
251.9 |
4987.6 |
197.99 |
|
2018 |
154.6 |
3651.9 |
236.19 |
101.4 |
1683.4 |
165.95 |
256.1 |
5335.3 |
208.36 |
|
2019 |
152.35 |
3867.2 |
253.84 |
99.80 |
1870.46 |
187.42 |
252.15 |
5737.66 |
227.55 |
|
2020 |
124.51 |
3429.60 |
275.45 |
85.21 |
1805.69 |
211.91 |
209.72 |
5235.29 |
249.63 |
|
2021 |
113.96 |
3472.59 |
304.72 |
82.58 |
1838.56 |
222.64 |
196.54 |
5311.15 |
270.23 |
|
Inc/Dec |
-8.47 |
1.25 |
10.63 |
– |
1.82 |
5.06 |
– 6.28 |
1.45 |
8.25 |
|
Tea |
|||||||||
Indian Auction prices Region wise category wise.
|
Sl/No. |
Year |
South India |
North India |
All India |
|||||||
|
CTC |
ORTH |
ALL TEAS |
CTC |
ORTH |
ALL TEAS |
CTC |
ORTH |
ALL TEAS |
|||
|
1. |
2017 |
93.75 |
123.19 |
96.52 |
139.23 |
202.97 |
143.98 |
129.05 |
179.10 |
133.11 |
|
|
2. |
2018
|
98.80 |
126.16 |
101.19 |
145.40 |
199.03 |
150.00 |
134.62 |
178.61 |
138.57 |
|
|
3. |
2019 |
93.79 |
127.93 |
96.52 |
142.17 |
200.34 |
324.12 |
131.85 |
187.35 |
137.65 |
|
|
4. |
2020 |
139.32 |
150.59 |
140.40 |
212.60 |
250.93 |
216.36 |
193.98 |
223.26 |
196.97 |
|
|
5. |
2021 |
– |
– |
– |
– |
– |
– |
– |
– |
116.97 |
|
|
Tea |
|||||||||||
Estimated domestic Consumption:
|
Sl. No. |
Year |
Estimated Consumption (In Million Kgs) |
|
1. |
2017 |
1059 |
|
2. |
2018 |
1084 |
|
3. |
2019 |
1109 |
|
4. |
2020* |
1135 |
|
Tea Board |
||
|
From year 2017 as per Study Report by M/s |
||
#
# #